Meet the TEAM!

Frank Autenrieth
frank.autenrieth@web.de

Cristina Morariu
cristina@morariu.ro

Peter Ruch
rutschifengga@gmail.com

Ivo Zeba
croivozeba@hotmail.com
frank.autenrieth@web.de
cristina@morariu.ro
rutschifengga@gmail.com
croivozeba@hotmail.com
Our application aims to help researchers discover properties of different stocks and possibly analyze trends in the
order book. Due to fluctuations of various parameters, the mechanics of the order book are still not very well understood.
A better understanding could help researcher find patterns and correlations that cause certain events in the market, for instance flash crashes.
In order to do this there are two different use cases for our data: on one hand we could analyse one stock: its properties, how they
changes in time, as well as what triggers the changes. On the other hand we can compare more stocks to each other and see correlations
between events and properties. As part of this project we will mainly focus on the first use case, although depending on time we might also
create views for the second use case.
Our tool will attempt to provide an interface for a user to find imbalances between different attributes (for example:
buy and sell orders) while still providing a larger overview of the market. The tool should easily allow one to see the
top of the book (difference between the highest bid and the lowest ask).
It may also allow for comparison between
different stocks which the user themselves will be able to select. Different attributes will be on display depending on
what is filtered. A time filter will also be available for aggregative purposes; allowing one to zoom into a specific
time frame to provide an even more in depth analysis. The tool will try to find co-dependencies between variables over
time in various intervals intervals.
Users: Dr. Gökhan Cebiroglu
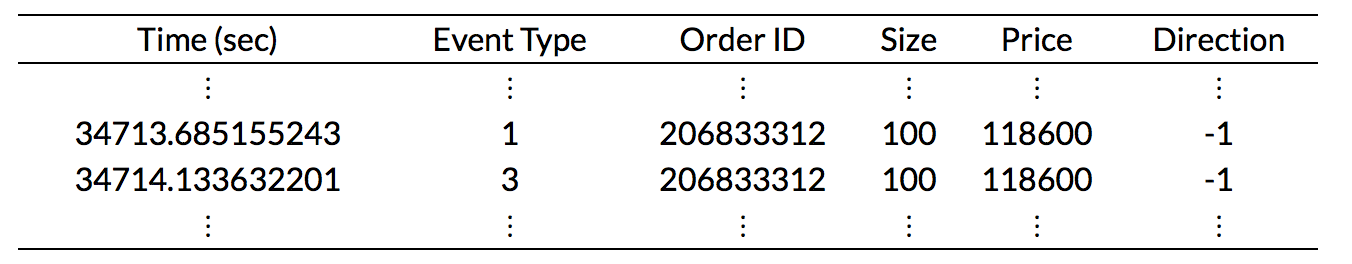
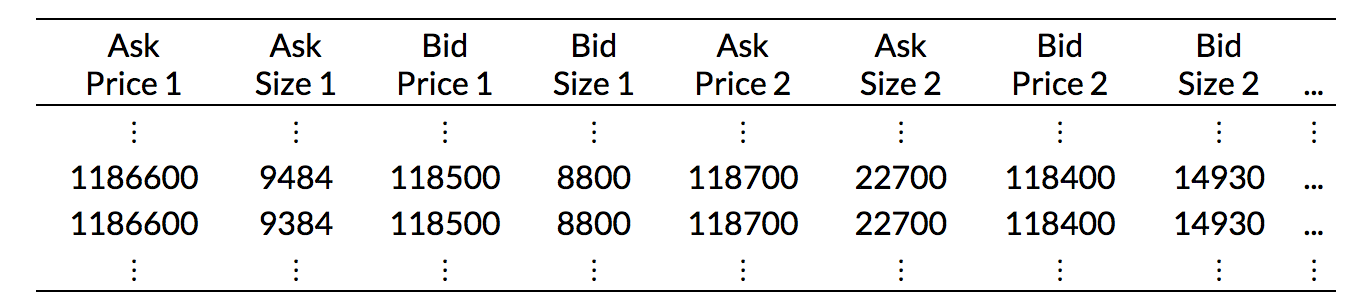
The basis data set for the analysis will be high-frequency trades as collected and distributed by the LOBSTER web service. Different files are available; orderbooks and messages. Order books show the evolution of the limit order book up to a specific level. This shows the interest of buying and selling at a particular instance through the best ask and bid prices with their respective volumes. Messages on the other hand show actual events (submission of new orders, cancellations, deletions, executions, etc.), the number of shares involved and whether a trade was initiated and with whom.
As part of our design phase, we propose a couple of paper prototypes, that showcase the interaction
the user will have with the visualization of the data. Here we present a detailed view of the workflow for
the first use case.
The following document contains the previously mentioned legacy paper mockups, their descriptions and usage scenarios. Thanks to the feedback of the second milestone, several discussions with our collaborateur from the statistics department as well additional feedback from Tom we were able to rework our initial proposals and come up with several better solutions.
Click here to download and see the legacy mockups.
As already mentioned for our project we are dealing with order book and message data from high frequency trading. The time aspect makes this data hard to deal with, as there might have been activities in the past (e.g. relatively big buy or sell orders, etc...) that heavily influenced the current state of the order book. We usually want to keep track of interesting events (e.g. price drops, trading halts, etc...) and explore whether some of the observed events show similar activity patterns in prior timeframes that might be responsible for the incidents. Ideally one would be able to use this information to get a better understanding of the high frequency trading mechanics.
After several iterations we finally came up with a proposal all parties were happy with. Our final mockup focuses on the detection of interesting activity patterns prior to notable events in the orderbook. The user is able to select a stock he is interested in and apply an event detection procedure - filter for large changes in price, trading volume, etc... - and start exploring the timeframes before these events. By visual comparison of these time intervalls the user might be able to get more insight into the trading data and possibly even generalize the effect of certain activity patterns.
While the final implementation - again - will differ a little bit from final mockup we want to give a short presentation of what we came up with and what issues/properties of the dataset each part of the mockup is aiming to address.
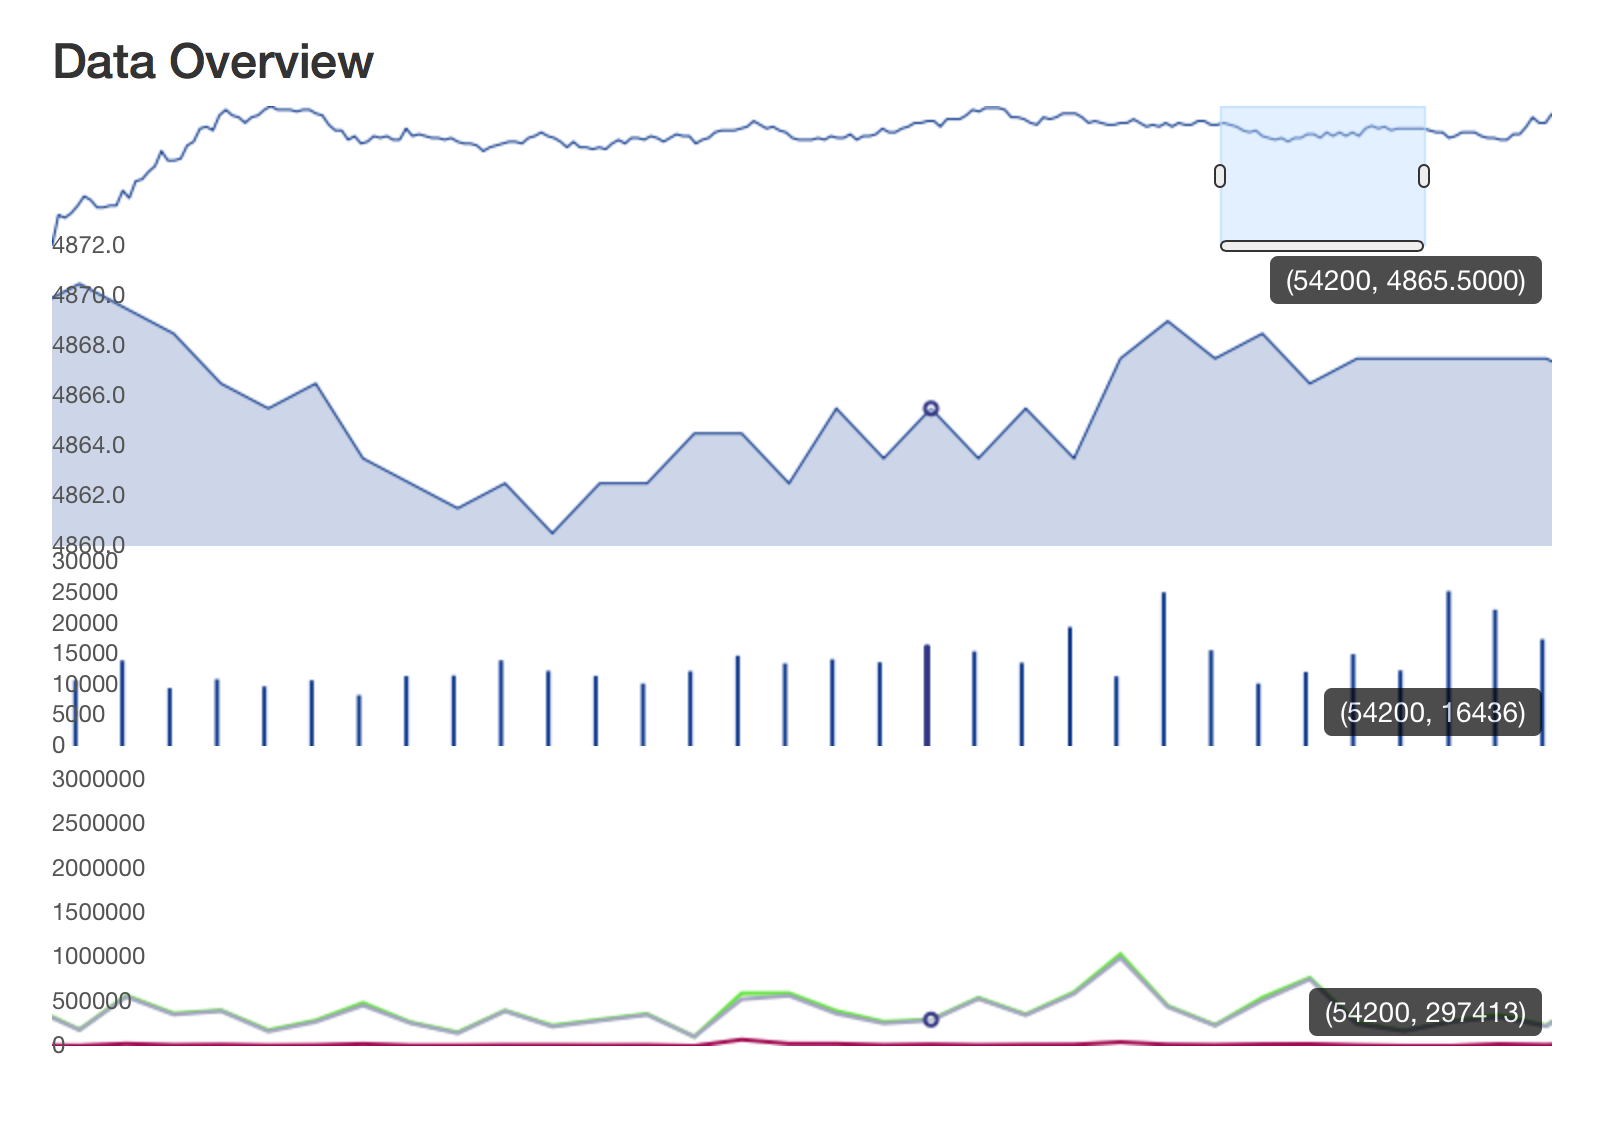
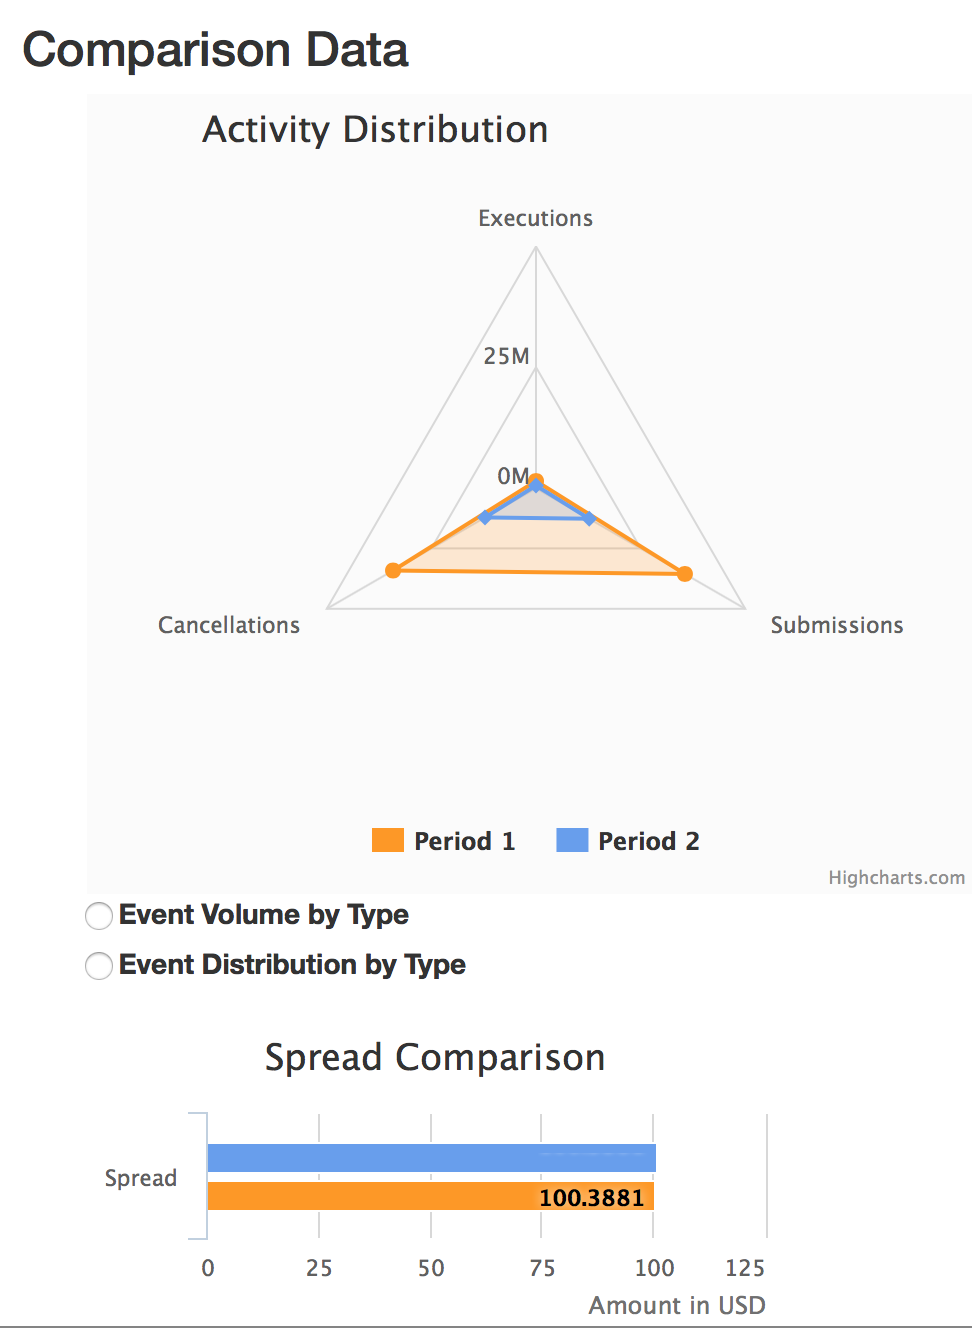
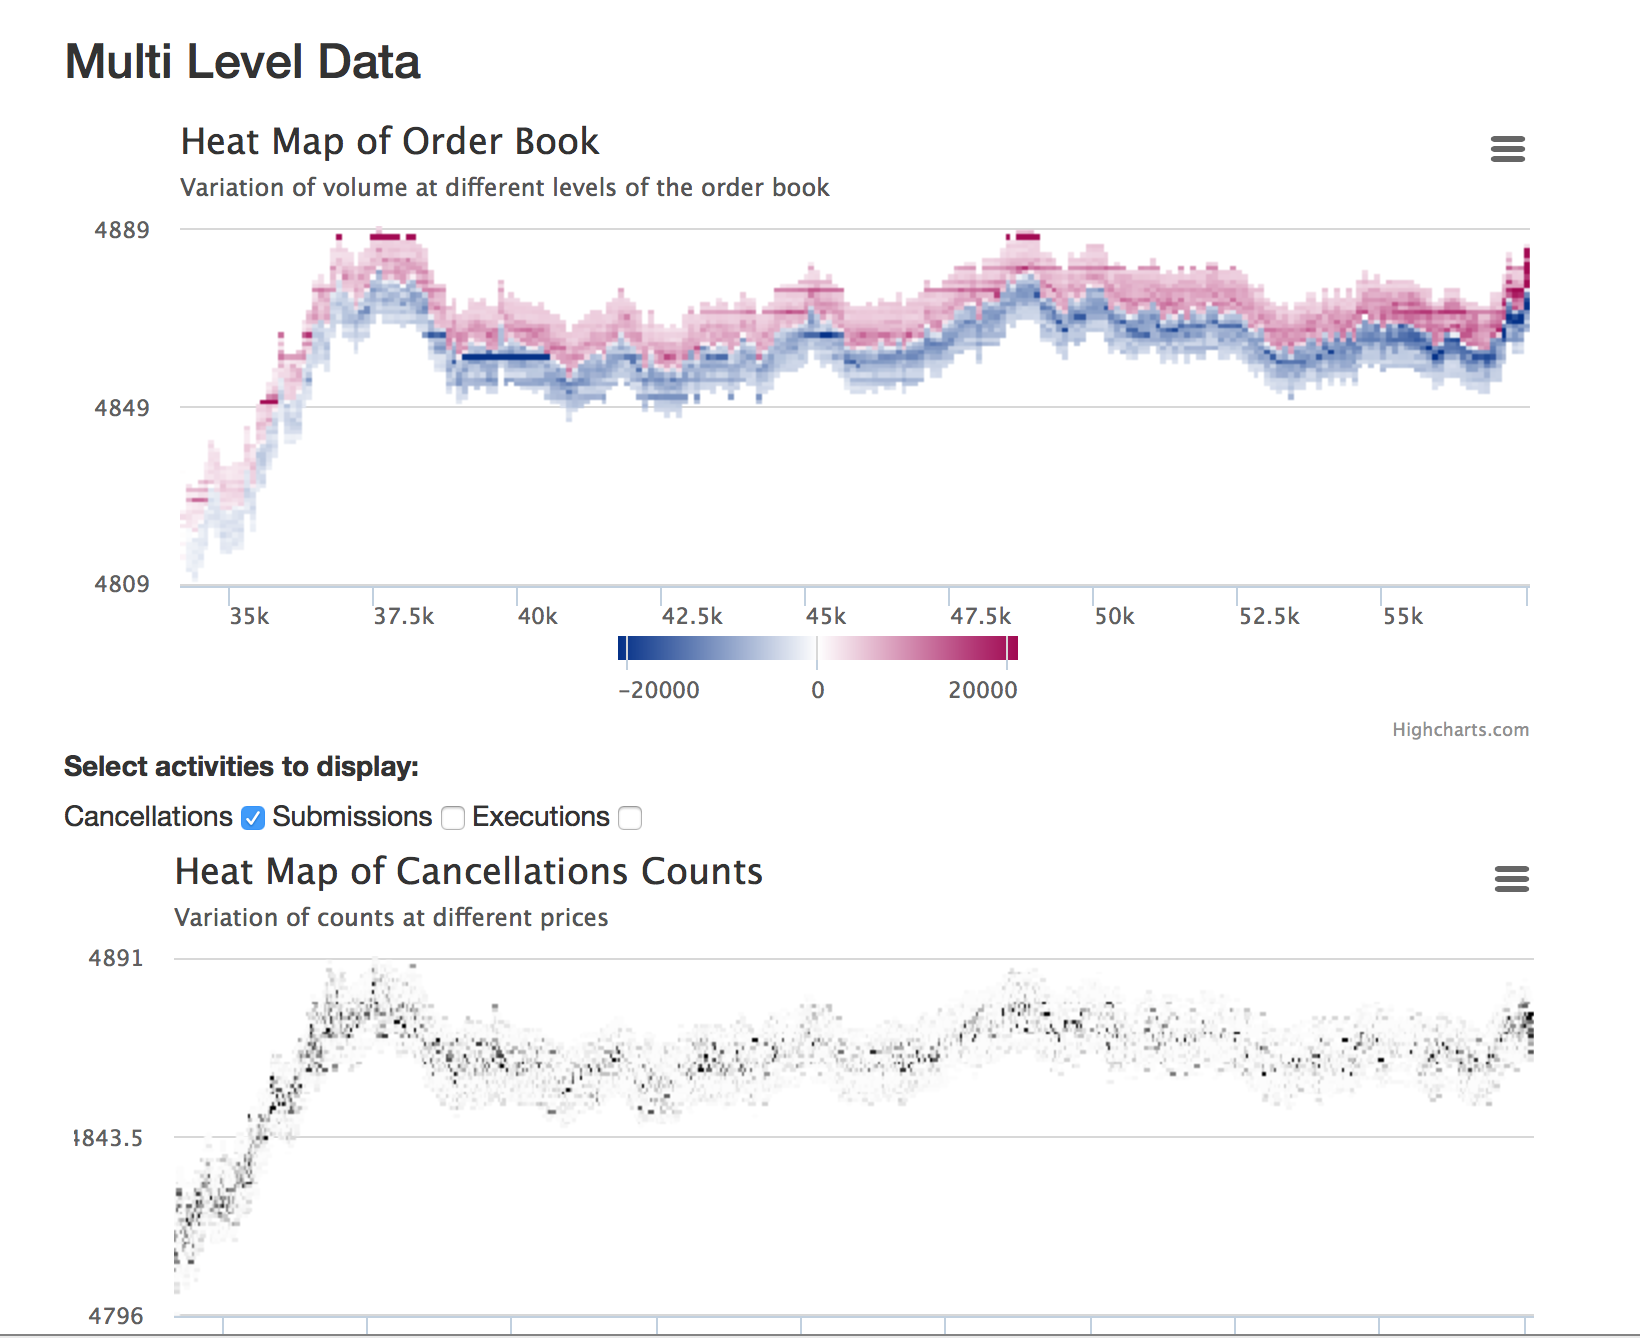
The left avatar combines the classic combination of midpoint price and volume over a selected timeframe as already known from standard finance related websites. We extended it with a linechart of the activities over time. This way the user is able to get an idea of the distribution of the activities. On the right upper side we have a starplot used for comparison of the aggregated activities over a timeframe, the chart below we already dropped again. The right hand stuff is really interesting. The plots are taken from a thesis from the ETH Zurich "Limit Order Book reconstruction, visualization and statistical analysis of the order flow" by Julien Schroeter. Inspired by this we created view that show the levels of the orderbook as hull of the midpoint price (plots in the middle). The lower charts show the cancelations over time, that were implemented using the same framework we used for the hull problem.
Initially we aimed at using an R backend with our visualization solutions being rendered on the frontend using Wolfram Mathematica. After our last discussion we realized that our collaborateur might be interested to extend the current functionality of the Lobster Service using our application and therefore needs the possibility to deploy it on the web.
We ditched Mathematica and concentrated on using Javascript powered plotting solutions - Envision.js and Highcharts. At this point we were still thinking of employing the R backend and do the heavy lifting there. It turned out that the interfacing between R and Javascript is not that trivial, while there are multiple bindings available their quality differ significantly. At that point we decided on using the openCPU API that allowed us to call R code using their Javascript library. Unfortunately this was not that straightforward to do as it required the complete app to be setup as an R package that is then loaded by openCPU. Due to this complexity and the general requirement for performant data storage another solution using MySQL was implemented in parallel that could be migrated to the R backend at some point (R would have also use the MySQL database). The current prototype is only using the SQL based backend, the complete R package is available if additional functionality is required in the future.
Due to the need for a sophisticated development environment, webserver and databases we decided to use the Vagrant provisioner for easy setup of identical working environments. Additionally Vagrant makes it easy to deploy our app.
| # | Milestone | Tasks | Begin Date | End Date |
|---|---|---|---|---|
| 1 | Project Summary | See vis page | - | April 14, 2015 |
| 2 | Proposal + Lo-Fi Prototyping | - | April 15, 2015 | May 7, 2015 |
| 3 | Pick and revise prototype | - | May 8, 2015 | May 11, 2015 |
| 3 | Start development | - | May 12, 2015 | May 28, 2015 |
| 3 | Prepare for Presentation | - | May 29, 2015 | June 04, 2015 |
| 4 | Refinement | Fix bugs and extend functionality | June 05, 2015 | June 07, 2015 |
| 4 | Evaluation | Allow others to evaluate the tool | June 08, 2015 | June 12, 2015 |
| 4 | Refinement | Fix bugs and make last second changes | June 13, 2015 | June 20, 2015 |
| 4 | Prepare for Final Presentation | - | June 23, 2015 | June 25, 2015 |
| 4 | Final Report | - | June 21, 2015 | June 30, 2015 |